Lecture Magdeburg 2001 - Slide 45: Unterschied zwischen den Versionen
Aus Transnational-Renewables
(Die Seite wurde neu angelegt: „{{Slide|VM2001_slide|en|45}}“) |
|||
| Zeile 1: | Zeile 1: | ||
{{Slide|VM2001_slide|en|45}} | {{Slide|VM2001_slide|en|45}} | ||
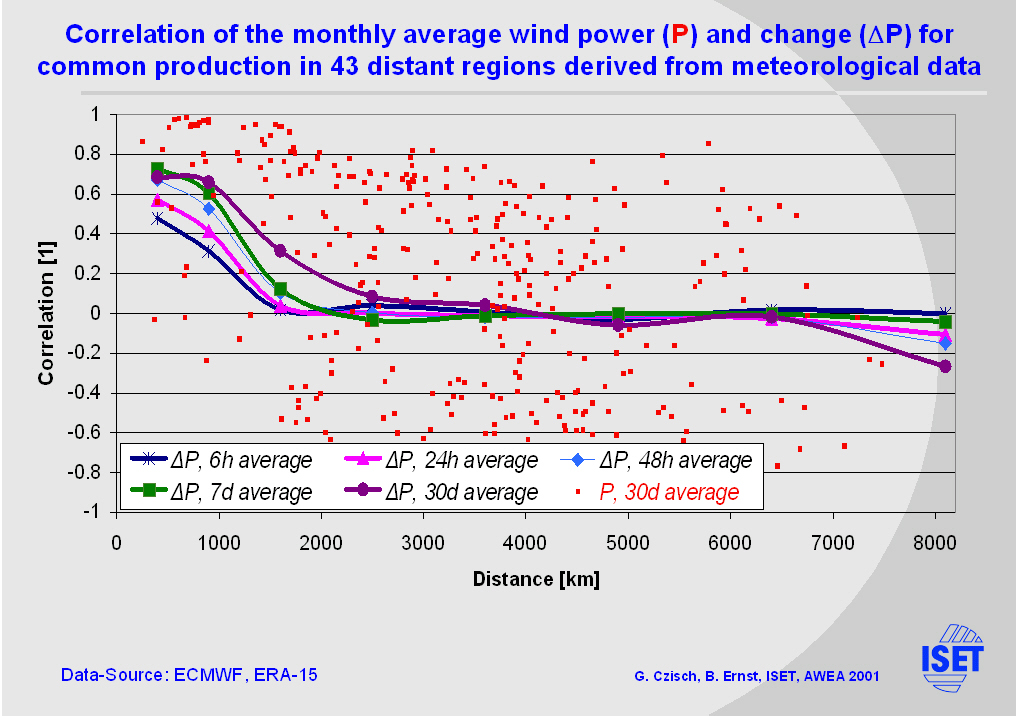
| + | From the region shown on the previous slide 43 subregions with good wind conditions have been selected to study the temporal behaviour of their potential wind power production. Here the mean correlation of the power changes is shown over the region‘s distance. As we see from the monthly mean, which is the violet line, the mean correlation drops down to almost zero at a distance of roughly 2000 km. This means that even considerable monthly smoothing effects can be achieved as soon as the catchment area reaches this sizes. | ||
Aktuelle Version vom 3. Oktober 2010, 12:15 Uhr
| Lecture Magdeburg [2001,en], Vortrag Lübeck [2006,de], Lecture Barcelona [2008,en], Vortrag EWEA 2000 [2000,en] |
| Vorstellung regenerativer Energien: Biomasse, Windenergie, Fallwindkraftwerke, Geothermie, Wasserkraft, Solarenergie |
| Overview | 
|
From the region shown on the previous slide 43 subregions with good wind conditions have been selected to study the temporal behaviour of their potential wind power production. Here the mean correlation of the power changes is shown over the region‘s distance. As we see from the monthly mean, which is the violet line, the mean correlation drops down to almost zero at a distance of roughly 2000 km. This means that even considerable monthly smoothing effects can be achieved as soon as the catchment area reaches this sizes.


