Lecture Magdeburg 2001 - Slide 42: Unterschied zwischen den Versionen
Aus Transnational-Renewables
(Die Seite wurde neu angelegt: „{{Slide|VM2001_slide|en|42}}“) |
|||
| Zeile 1: | Zeile 1: | ||
{{Slide|VM2001_slide|en|42}} | {{Slide|VM2001_slide|en|42}} | ||
| + | This diagram points out the spacio- temporal behaviour of wind power. | ||
| + | |||
| + | Here you see the correlation of the change of power from two wind turbines printed versus the averaging time. It can be derived that fluctuations due to the low correlation within shorter time intervals of some minutes can be smoothened even within one bigger wind park. | ||
Aktuelle Version vom 3. Oktober 2010, 12:14 Uhr
| Lecture Magdeburg [2001,en], Vortrag Lübeck [2006,de], Lecture Barcelona [2008,en], Vortrag EWEA 2000 [2000,en] |
| Vorstellung regenerativer Energien: Biomasse, Windenergie, Fallwindkraftwerke, Geothermie, Wasserkraft, Solarenergie |
| Overview | 
|
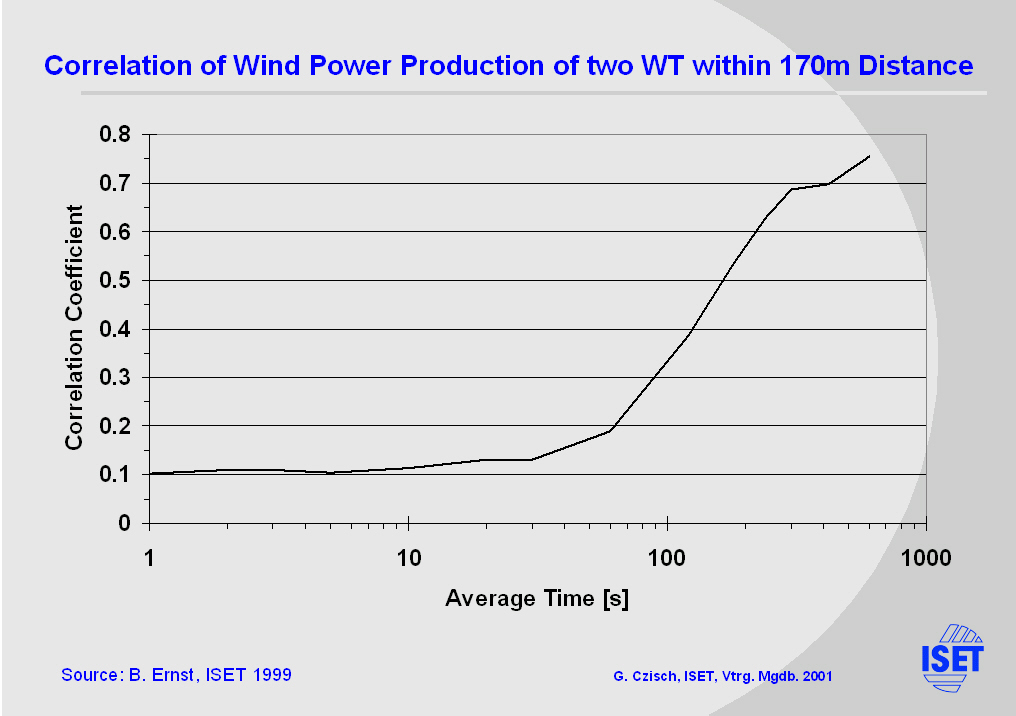
This diagram points out the spacio- temporal behaviour of wind power.
Here you see the correlation of the change of power from two wind turbines printed versus the averaging time. It can be derived that fluctuations due to the low correlation within shorter time intervals of some minutes can be smoothened even within one bigger wind park.


